(Note: For weather history prior to January 2023, click
here.)
Daily / Monthly Weather History From This Station
Daily Report for the month of July 2026
| 11 July Average and Extremes |
| Average temperature | 85.8°F |
| Average humidity | 66% |
| Average dewpoint | 72.5°F |
| Average barometer | 30.0 in. |
| Average windspeed | 2.2 mph |
| Average gustspeed | 3.9 mph |
| Average direction | 154° (SSE) |
| Rainfall for month | 0.00 in. |
| Rainfall for year | 0.00 in. |
| Maximum rain per minute | 0.00 in. on 11 at 23:59 |
| Maximum temperature | 96.6°F on 11 at 16:04 |
| Minimum temperature | 62.2°F on 11 at 03:02 |
| Maximum humidity | 85% on 11 at 03:01 |
| Minimum humidity | 48% on 11 at 17:13 |
| Maximum pressure | 30.114 in. on 11 at 23:44 |
| Minimum pressure | 29.946 in. on 11 at 03:00 |
| Maximum windspeed | 12.7 mph on 11 at 23:54 |
| Maximum gust speed | 25.3 mph from 126 °(SE) on 11 at 23:51 |
| Maximum heat index | 110.9°F on 11 at 14:49 |
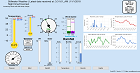
Click here to toggle the 24 Hour Graph of this day

| Average and Extremes for Month of July 2026 up to day 11 |
| Average temperature | 80.9°F |
| Average humidity | 73% |
| Average dewpoint | 70.7°F |
| Average barometer | 30.060 in. |
| Average windspeed | 2.4 mph |
| Average gustspeed | 4.2 mph |
| Average direction | 145° (SE) |
| Rainfall for month | 5.15 in. |
| Rainfall for year | 1.74 in. |
| Maximum rain per minute | 0.02 in on 12 at 06:45 |
| Maximum temperature | 96.6°F on 11 at 16:04 |
| Minimum temperature | 62.2°F on 11 at 03:02 |
| Maximum humidity | 91% on 12 at 08:11 |
| Minimum humidity | 48% on 11 at 17:13 |
| Maximum pressure | 30.18 in. on 12 at 12:19 |
| Minimum pressure | 29.95 in. on 11 at 03:00 |
| Maximum windspeed | 13.8 mph from 120°(ESE) on 12 at 00:09 |
| Maximum gust speed | 25.3 mph from 135°(SE) on 11 at 23:51 |
| Maximum heat index | 110.9°F on 11 at 14:49 |
| Avg daily max temp | 96.6°F |
| Avg daily min temp | 62.2°F |
| Growing degrees days | 56.1 GDD |
| Day, Sunshine Hours, ET, Max Solar, UV |
| 01 00:54hrs |
ET :0.35 in. |
0.0 W/m² |
0.0 uv |
| 02 00:00hrs |
ET :0.00 in. |
0.0 W/m² |
0.0 uv |
| 03 00:00hrs |
ET :0.00 in. |
0.0 W/m² |
0.0 uv |
| 04 00:00hrs |
ET :0.00 in. |
0.0 W/m² |
0.0 uv |
| 05 00:00hrs |
ET :0.00 in. |
0.0 W/m² |
0.0 uv |
| 06 00:00hrs |
ET :0.00 in. |
0.0 W/m² |
0.0 uv |
| 07 00:00hrs |
ET :0.00 in. |
0.0 W/m² |
0.0 uv |
| 08 00:00hrs |
ET :0.00 in. |
0.0 W/m² |
0.0 uv |
| 09 00:00hrs |
ET :0.00 in. |
0.0 W/m² |
0.0 uv |
| 10 00:00hrs |
ET :0.00 in. |
0.0 W/m² |
0.0 uv |
| 11 00:00hrs |
ET :0.00 in. |
482.4 W/m² |
9.1 uv |


