• Forecasts
    • 5 Day NWS Forecast
    • 10 Day Forecast
    • WU 10 Day Forecast
    • Hourly Forecast For Stillwater
    • 30 Day National Forecast
    • Forecast Discussion
    • Severe Weather Forecast Maps
    • UV Forecast
  • Satellite Views
    • Real Time Animated
    • Selectable Satellite Loops
    • Oklahoma Visible Loop
    • Eastern U. S.
    • Western U. S.
    • Mid South
  • Weather Links
    • Current Weather Conditions Across Oklahoma
    • Weather at Nearby Airports
    • Oklahoma Lightning Activity With Sound
    • Oklahoma Mesonet
    • Oklahoma Drought Monitor
    • Forecast Model Maps
    • Tropical Activity
    • Other Weather Links
  • Features
    • Stillwater Extreme WX Videos
    • Stillwater Climate
    • Stillwater Weather Photos
    • Live Steel Gauges
    • Live Stillwater NOAA Radio Station
    • Chandler Burning Index
    • Oklahoma Earthquake Page
    • Moon Phase
    • Weather For Your Smart Phone
    • That Friday the 13th Tornado, 1975
    • 1990 Stillwater Tornado Reviewed
  • Earthquakes
  • 2nd Home
  • Main Home

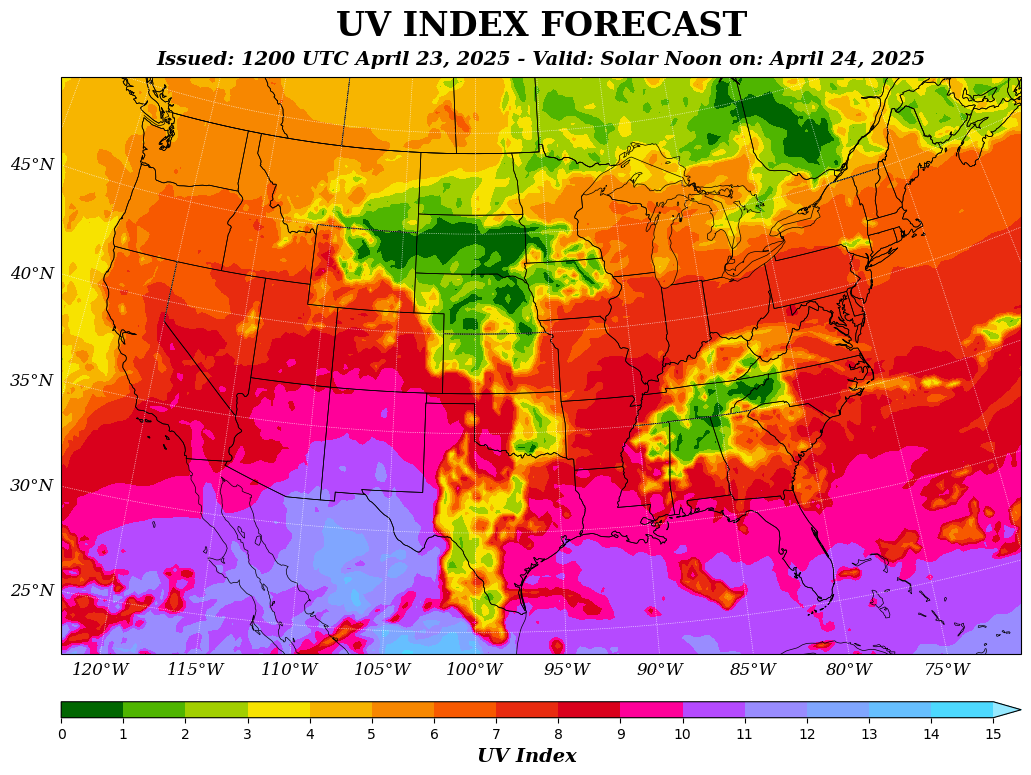
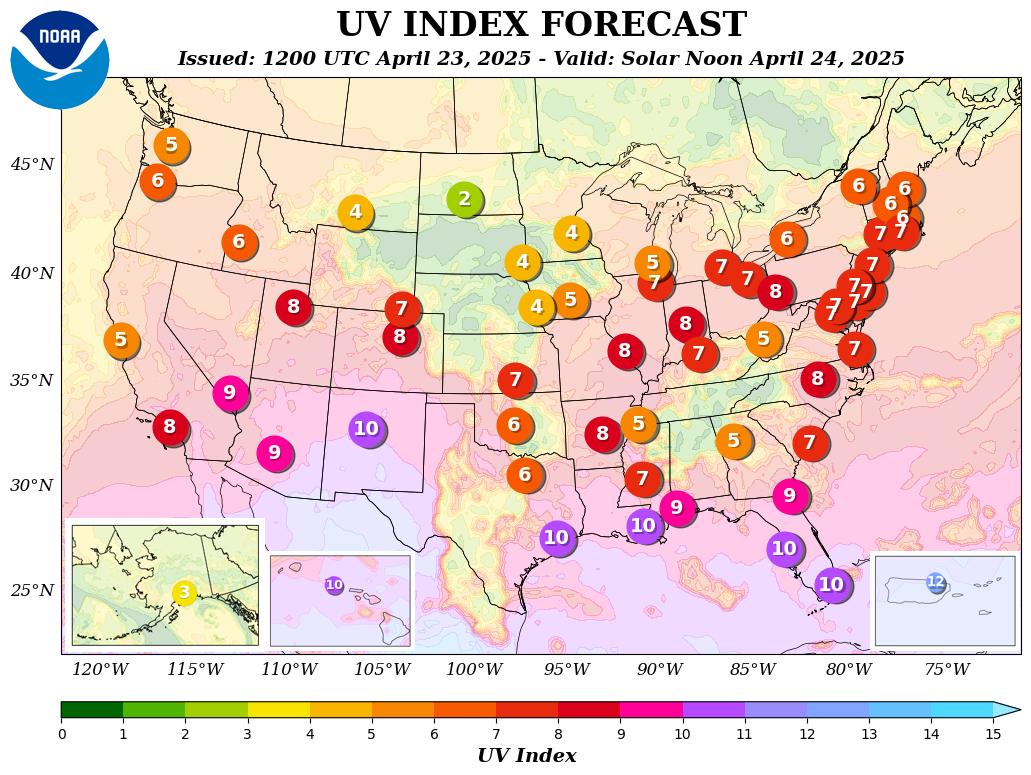
Stillwater UV Index Forecast

UV Forecast May 09 2025 is 8.0
(UV forecast courtesy of and Copyright © KNMI/ESA (http://www.temis.nl/). Used with permission.)
UV forecast: May 09 2025 is 8.0   Very High 

UV forecast: May 10 2025 is 8.6   Very High 

UV forecast: May 11 2025 is 8.1   Very High 

UV forecast: May 12 2025 is 8.5   Very High 

UV forecast: May 13 2025 is 8.8   Very High 

UV forecast: May 14 2025 is 9.4   Very High 


What is the UV Index?

The UV Index provides a daily forecast of the expected risk of overexposure to the sun. The Index predicts UV intensity levels on a scale of 0 to 11+, where 0 indicates a minimal risk of overexposure and 11+ means a very high risk. Some exposure to sunlight can be enjoyable; however, too much could be dangerous. Overexposure to the ultraviolet (UV) rays of the sun radiation can cause immediate effects, such as sunburn, and long-term problems, such as skin cancer and cataracts. The UV Index, which was developed by the National Weather Service and the U.S. Environmental Protection Agency (EPA), provides important information to help you plan your outdoor activities to prevent overexposure to sun rays.

The UV index and the corresponding exposure level as categorized by the World Health Organization are shown in the table on the right.


UV Index
Exposure Level
0-2
Low
3-5
Moderate
6-7
High
8-10
Very High
>= 11
Extreme
UV Index Category Sunburn Time
over 9 extreme less than 15 minutes
7-9 high about 20 minutes
4-7 medium about 30 minutes
0-4 low more than 1 hour

National UV Index

graphic
uv map

No Warnings, Watches, or Advisories for Stillwater Area
NATIONAL WEATHER MAP AND
MIDSOUTH RADAR:
National Weather Map

Mid South Radar

red arrowZoom in on Stillwater With Interactive Radar

NOAA Weather Radio logo
Tune in NOAA Weather Radio Stations
From Stillwater or Across the Nation

Find local storm reports from the Oklahoma City area or around the country


Oklahoma Area Earthquakes

See Current Moon Phase -> here.
Chandler Burn Index:
Fire Danger Level
Burn Bans by County

AREA WEATHER SITES
Stillwater Extreme Weather Videos
Oklahoma Mesonet
Oklahoma Drought Monitor


SPECIAL FEATURE:tornado Recalling Stillwater's Friday the 13th Tornado from 1975

OTHER LINKS
Current Moon Phase
Stillwater Gas Prices
About This Site
Stillwater UV Forecast
THIS SITE MEMBER OF:

Midsouth Weather Network logo

wubanner

More Memberships


Thanks for visiting stillwaterweather.com. More than just a forecast. Email