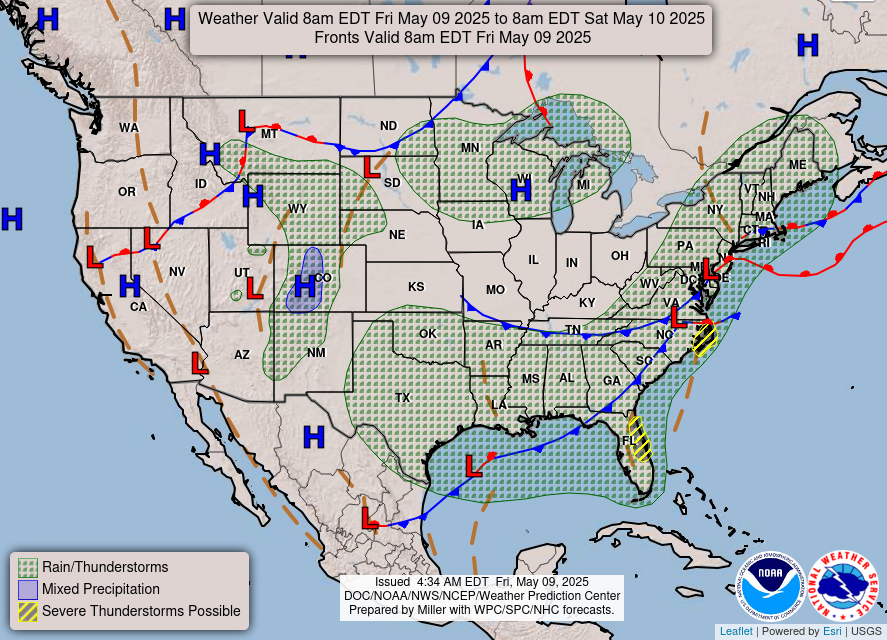
Chandler Burning Index Description
| LOW <50 |
MODERATE 50-75 |
HIGH 75-90 |
VERY HIGH 90-97.5 |
EXTREME <97.5 |
The Chandler Burning Index (CBI) uses the air temperature and relative humidity to calculate a numerical index of fire danger. That number is then equated to the Fire Danger severity of either extreme, very high, high, moderate, or low. It's based solely on weather conditions, with no adjustment for fuel moisture. Here on the K3JAE Weather site, the CBI is calculated from the current weather conditions and reflects the current calculated fire danger. The National Weather Service calculates a 30 day Chandler Burning Index based on forecasted weather conditions for the month. The monthly fire potential is represented by a modified version of the Chandler Burning Index (CBI). CBI provides a measure of the effects of average monthly temperature and humidity on fire intensity and rate of spread (not the same as NFDRS rate of spread). Both the intensity and spread components of the Index are linearly related to temperature (an increase in temperature results in a proportionately higher Index), but are exponentially related to humidity (a small decrease in humidity results in a large increase in the Index). The modified version of the Chandler Burning Index is computed from:
CBI = (((110 - 1.373*RH) - 0.54 * (10.20 - T)) * (124 * 10**(-0.0142*RH)))/60
where:
RH = forecast monthly mean afternoon relative humidity (percent)
T = forecast monthly mean afternoon temperature (degrees Celsius)
The Chandler Burning Index has been shown to be highly correlated with monthly fire activity.
 |
|
| Fire Danger Rating and Color Code | Description |
| Low (L) (Green) | Fuels do not ignite readily from small firebrands although a more intense heat source, such as lightning, may start fires in duff or punky wood. Fires in open cured grasslands may burn freely a few hours after rain, but woods fires spread slowly by creeping or smoldering, and burn in irregular fingers. There is little danger of spotting. |
| Moderate (M) (Blue) | Fires can start from most accidental causes but, with the exception of lightning fires in some areas, the number of starts is generally low. Fires in open cured grasslands will burn briskly and spread rapidly on windy days. Timber fires spread slowly to moderately fast. The average fire is of moderate intensity, although heavy concentrations of fuel, especially draped fuel, may burn hot. Short-distance spotting may occur, but is not persistent. Fires are not likely to become serious and control is relatively easy. |
| High (H) (Yellow) | All fine dead fuels ignite readily and fires start easily from most causes. Unattended brush and campfires are likely to escape. Fires spread rapidly and short-distance spotting is common. High-intensity burning may develop on slopes or in concentrations of fine fuels. Fires may become serious and their control difficult unless they are attacked successfully while small. |
| Very High (VH) (Orange) | Fires start easily from all causes and, immediately after ignition, spread rapidly and increase quickly in intensity. Spot fires are a constant danger. Fires burning in light fuels may quickly develop high intensity characteristics such as long-distance spotting and fire whirlwinds when they burn into heavier fuels. |
| Extreme (E) (Red) | Fires start quickly, spread furiously, and burn intensely. All fires are potentially serious. Development into high intensity burning will usually be faster and occur from smaller fires than in the very high fire danger class. Direct attack is rarely possible and may be dangerous except immediately after ignition. Fires that develop headway in heavy slash or in conifer stands may be unmanageable while the extreme burning condition lasts. Under these conditions the only effective and safe control action is on the flanks until the weather changes or the fuel supply lessens. |